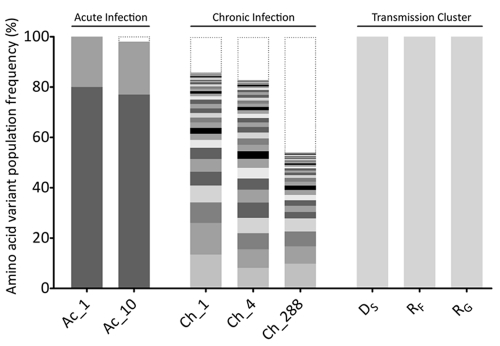
Fig 4.
Comparison of the intrahost distributions of NoV variants in all subjects. Full-length NoV variants of the ORF2 region were reassembled from NGS reads and translated into amino acid sequences, and each unique variant is represented by alternate gray shading. The histogram shows the frequency distribution of unique NoV variants in each sample analyzed. Low-frequency variants, with an estimated frequency of occurrence below the detection threshold (2%), are indicated by black dotted lines. For the subject with acute infection (subject Ac), only two variants were detected, with frequencies of occurrence of ∼79% and ∼20%, respectively. These variants remained stable over the 9 days of infection. For the subject with chronic infection (subject Ch), no dominant variant was observed. Instead, a distribution of low-frequency variants coexisted, and their prevalences varied over the course of the infection. A single variant was identified in each subject within the transmission cluster cohort (subjects DS, RF, and RG).

