Fig 5.
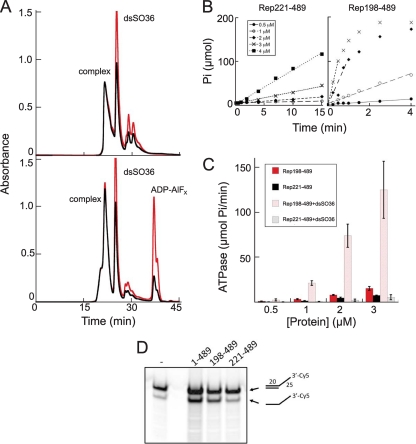
Properties of Rep198-489/dsDNA complexes. (A) Size exclusion chromatographic analysis (on TSKgel Super SW3000) of Rep198-489/dsSO36 complexes formed at 3.9 mg/ml (120 μM) and a 6:2 protein/DNA molar ratio with (bottom) or without (top) ADP-AlFx. Peaks corresponding to the formed complex, unbound DNA (dsSO36), and excess ADP-AlFx are marked. The A260 is indicated in red; the A280 is indicated in black. (B) Representative ATPase data for Rep221-489 (left) and Rep198-489 (right), both in the presence of dsSO36 DNA, plotted as μmol of free phosphate (Pi) released as a function of time. (C) The initial rate of ATP hydrolysis as a function of time was determined for Rep221-489 and Rep198-489 with or without DNA. The error bars indicate the standard deviations calculated for four separate experiments. (D) The helicase activities of Rep1-489, Rep198-489, and Rep221-489 were compared using a 3′-Cy5-labeled oligonucleotide with a 3′-single stranded T25 extension. The first lane corresponds to the annealed substrate (shown schematically on the right, top) in the absence of protein. The percent substrate converted to product (after corrections for background and contaminating product in the starting substrate) are 25% (Rep1-489), 21% (Rep198-489), and 3.5% (Rep221-489).

