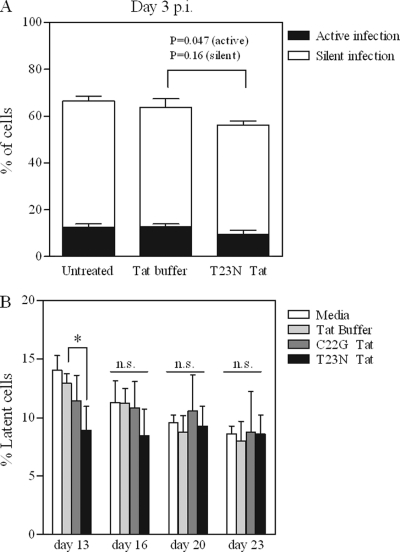
Fig 3.
Modest inhibition of the establishment of latency by purified Tat. (A) Jurkat cells were infected with attenuated tat virus as described for Fig. 1. A single 24-h treatment with high concentration (125 μg/ml) T23N Tat, in the absence of a protein transfection reagent, was begun starting at 16 h p.i. At 48 h p.i., cells were treated with TNF-α (or control) to reactivate silently integrated virus. At 72 h p.i., levels of total, active, and silent virus were determined by flow cytometry for viral EGFP as follows: total infection = % GFP+ cells after TNF-α treatment; active infection = % GFP+ cells after control treatment; silent/latent infection = active infection subtracted from total infection. Unpaired two-tailed t tests were performed on T23N-treated versus control Tat buffer-treated cells, for both active infection and silent infection. (B) Jurkat cells were infected with attenuated tat virus as described for Fig. 1. Beginning at 16 h p.i., cells were treated with 12.5 μg/ml C22G or T23N Tat in the presence of a protein transfection reagent for 24 h. This treatment was repeated twice (i.e., starting 24 and 48 h after the first treatment began) for a total of three 24-h treatments. Latent virus was reactivated with TNF-α and quantified by flow cytometry for viral EGFP on days 13, 16, 20, and 23 p.i. One-way ANOVA was performed on the results for each treatment day; Dunnett's multiple comparison post test was used to compare Tat-treated versus buffer-treated cells when significant differences were found by one-way ANOVA. *, P < 0.05; n.s., not significant. All results represent mean ± standard deviation (SD) of results of three independent experiments.

