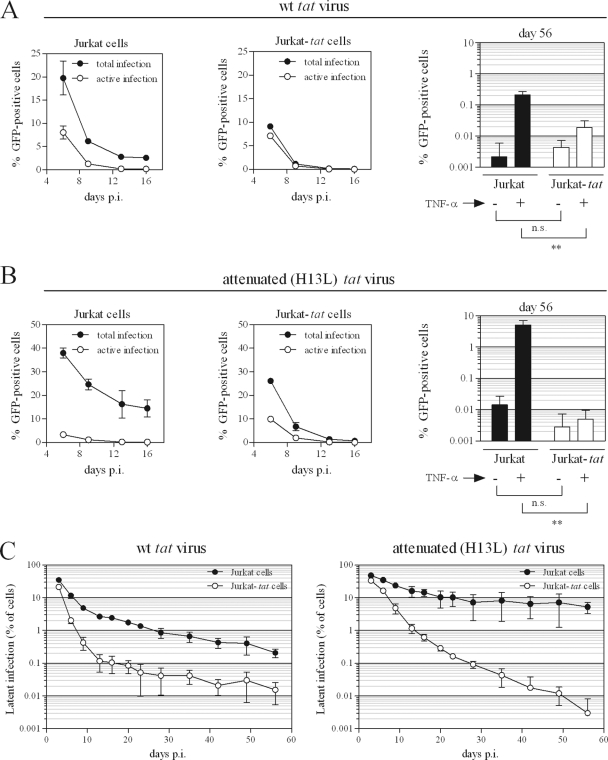
Fig 5.
Potent inhibition of the establishment of latency by intracellularly expressed Tat. (A and B) Jurkat or Jurkat-tat cells were infected with wt (A) or attenuated (B) tat virus as described for Fig. 1. Levels of total and active infection over the first 16 days of infection (left and middle panels) and on day 56 (right panels) are shown. Total infection = % GFP+ cells after TNF-α treatment; active infection = % GFP+ cells after control treatment; silent infection = active infection subtracted from total infection. t tests were used to compare levels of GFP-positive cells at 56 days p.i. following TNF-α or control treatment, for Jurkat versus Jurkat-tat cells. **, P < 0.01; n.s., not significant. (C) Levels of latent infection throughout 56 days are shown for wt (left panel) or attenuated (right panel) tat virus infection of Jurkat and Jurkat-tat cells. All results represent mean ± standard deviation (SD) of results of three independent experiments. t tests were used to compare latent infection levels at 56 days p.i. for Jurkat versus Jurkat-tat cells; P = 0.0060 for wt tat virus; P = 0.0096 for attenuated tat virus.

