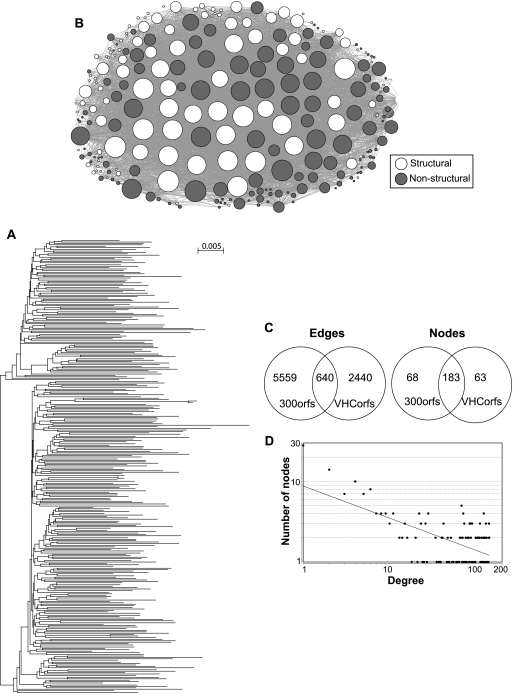
Fig 2.
Covariance network for the set of 300 hepatitis C virus 1a sequences. (A) Phylogenetic tree for the HCV 1a sequences. (B) Network graph. The circles represent the amino acid positions (nodes), and the lines (edges) between the nodes represent covariances. The sizes of the nodes are proportional to the number of edges they contact. (C) Comparison of the numbers of edges and nodes in the original HCV covariance networks generated from 47 HCV subtype 1a sequences (VHCorfs) and in the new networks generated from 300 1a sequences (300orfs). (D) Degree distribution plot fitted to the power law for the network in panel B.

