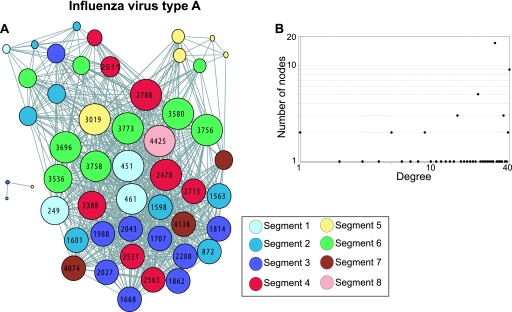
Fig 5.
Covariance network for influenza virus A. (A) Network graph. The sizes of the nodes are proportional to the number of edges that they contact. The nodes are color coded by segment, and the node numbers indicate the position in the concatenated gene alignments. See Table S2 in the supplemental material for a key to the numbering of the various genes. (B) Degree distribution plot.

