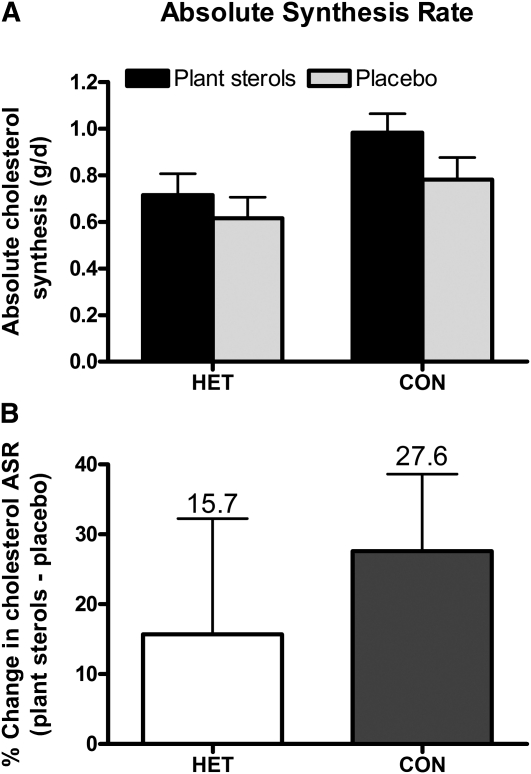
FIGURE 2.
Mean (±SEM) absolute synthesis rates of cholesterol in response to consumption of plant sterol compared with placebo capsules in phytosterolemia heterozygotes and control cohorts (A) and the percentage change in the absolute synthesis rate of cholesterol between treatments within group (B). Differences between groups and treatments were assessed by repeated-measures 2-factor ANOVA; P < 0.05 indicates a significant difference between treatments within group. A: P-interaction = 0.522. ASR, absolute synthesis rate; CON, control group (n = 15); HET, phytosterolemia heterozygote group (n = 10).

