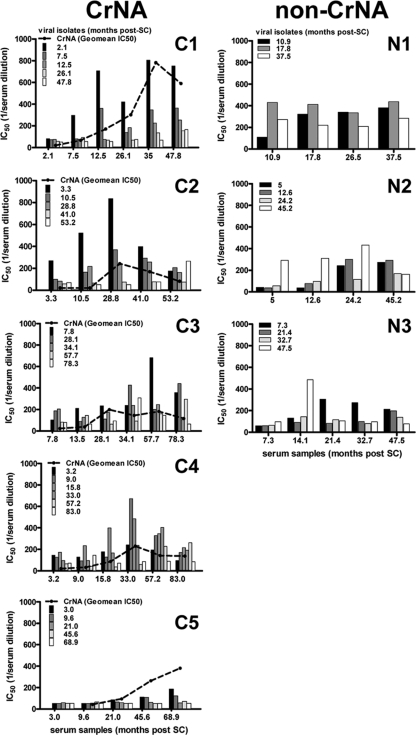
Fig 2.
Cross-reactive and autologous neutralizing activity developed with similar kinetics. The height of individual bars indicates the average IC50s in the serum (y axis) at the indicated month post-SC (x axis), as determined by linear regression of IC50s achieved on ≤5 autologous virus variants per time point. C1 to C5, individuals with CrNA; N1 to N3, individuals who lacked CrNA. The geometric mean IC50s across the heterologous 6-virus panel are shown as dashed lines for individuals with CrNA. Patient C6 is absent from this analysis, because no viruses could be isolated.

