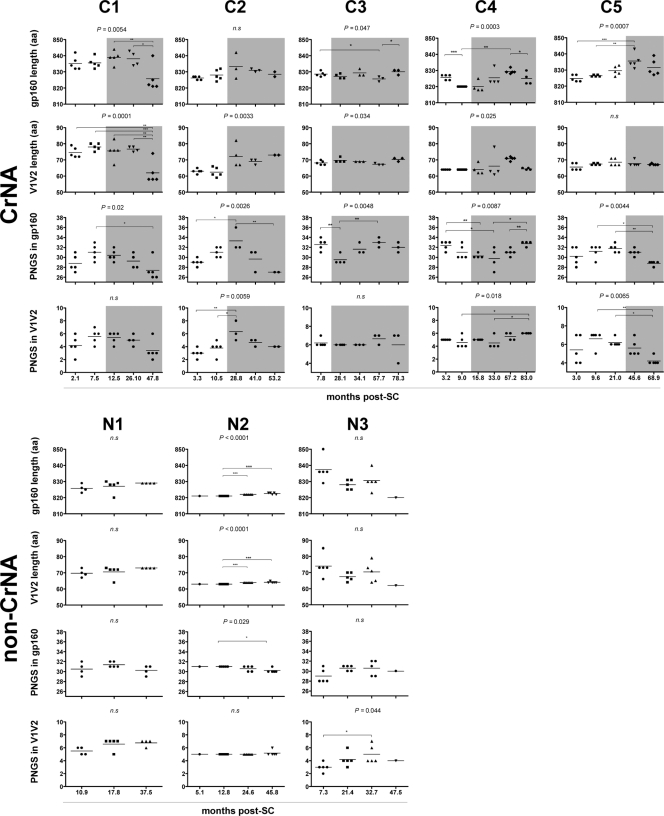
Fig 3.
Longitudinal analysis of changes in the length of gp160 and the number of PNGS. Data for individuals with CrNA (C1 to C5) are grouped at the top, and data for individuals lacking CrNA (N1 to N3) are grouped at the bottom. Each dot represents one clonal virus variant. The horizontal bars indicate mean values per time point. P values above graphs were calculated by ANOVA across all time points, and individual differences were calculated using Bonferroni's multiple-comparison test for independent samples. Shaded areas indicate the presence of CrNA. The lengths of gp160 and V1V2 and the numbers of PNGS in gp160 and V1V2 are shown for both groups. *, P < 0.05; **, P < 0.01; ***, P < 0.001; n.s, nonsignificant. Patient C6 is absent from this analysis because no viruses could be isolated.

