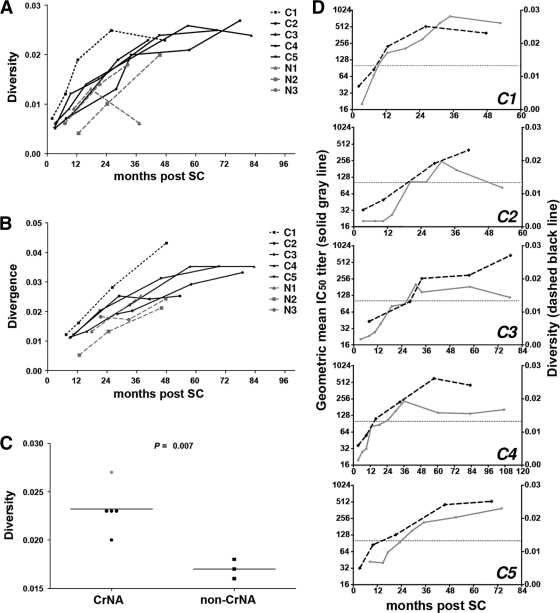
Fig 4.
Diversity and divergence of HIV-1 gp160 sequences. (A) Sequence diversity across all clones of gp160 per time point is shown for individuals with (black lines) and without (gray dashed lines) CrNA, including one elite neutralizer (black dotted line) (C1), following seroconversion. (B) Divergence between subsequent time points during follow-up. Each dot depicts the latest of the subsequent time points for the same individuals for whom results are shown in panel A. (C) The mean diversity across all viral clones isolated within 5 years postseroconversion per individual is shown for individuals with and without CrNA. The elite neutralizer is represented by the gray dot. (D) Sequence diversity (gp160) (right y axis) and geometric mean IC50s across the 6-virus panel (left y axis) per time point depicted across the period of infection for individuals with CrNA. Patient C6 is absent from this analysis because no viruses could be isolated.

