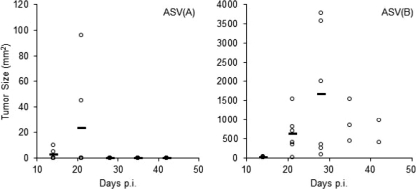
Fig 2.
Growth of sarcomas induced after infection with 100 FFU of ASV in line P 10-day-old chicks. Tumor sizes (mm2) induced in chicks infected with ASV(A) (left) or ASV(B) (right) were measured on the days indicated. The tumor size in each bird is indicated by an individual dot, with the average tumor size for the group shown with a horizontal bar. Note the different y-axis scales. Only two tumors were induced by ASV(A); the results for the remaining four chicks without tumors overlap on the x axis. Only three and two chicks survived on days 35 and 42, respectively; the rest of the chicks were sacrificed before they reached the terminal stage.

