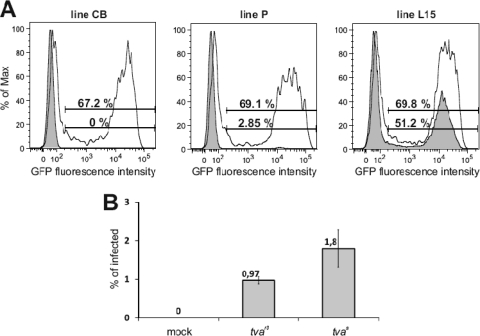
Fig 4.
Expression of the cloned tvas and tvar3 confers susceptibility to the subgroup A ASLV. (A) CEFs of the CB (left), P (middle), and L15 (right) lines were transfected with a tvas expression vector, infected at a multiplicity of infection of 1 with RCASBP(A)GFP at 1 day p.t., and analyzed by FACS at 2 days postinfection as a mean of three parallel dishes. Open curves of FACS histograms represent cells transfected with tvas; shaded curves represent mock-transfected cells. The relative fluorescence is plotted against the cell count, and the percentages of GFP-positive tvas-transfected cells (top) and GFP-positive mock-transfected cells (bottom) are given. (B) CEFs of the CB line transfected with a low dose of either tvas and tvar3, i.e., 0.02 μg of either pVITROtdTomato-tvaL15 or pVITROtdTomato-tvaP plasmids per 5 × 10⁴ cells in a 3.8-cm2 well, infected at a multiplicity of infection of 1 with RCASBP(A)GFP at 1 day p.t., and analyzed by FACS at 2 days postinfection. Percentages of GFP-positive cells from FACS are shown as means and standard deviations from two parallel dishes.

