Fig 5.
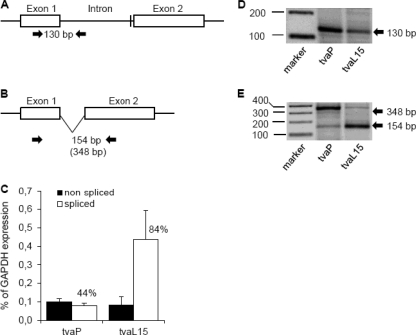
Transcription and splicing of the tvar3 allele in line P and wild-type tvas allele in the L15 line. Schematic representation of intron 1 retention (A) and splicing (B), together with positions of primers for the splice-specific PCR (arrows) and the sizes of diagnostic PCR products. The position of the intronic deletion is denoted by a vertical bar. (C) The levels of nonspliced (black columns) and spliced (open columns) transcripts of the tvar3 allele in line P and tvas allele in line L15 were estimated by qRT-PCR and are shown as the average percentage of the GAPDH expression ± SD from three triplicates. (D) The molecular sizes of the RT-PCR products of nonspliced tva mRNA are shown. Lane 1, marker of molecular size (indicated on the left, in base pairs); lane 2, nonspliced tvar3 mRNA, RT positive; lane 3, nonspliced tvas mRNA, RT positive. (E) The molecular sizes of the RT-PCR product of spliced tva mRNA are shown. Lane 1, marker of molecular size; lane 2, spliced tvar3 mRNA, RT positive; lane 3, spliced tvas mRNA, RT positive.

