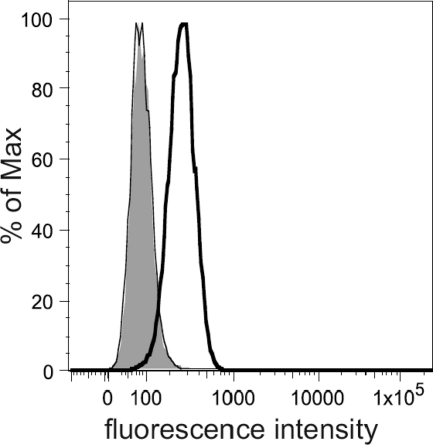
Fig 6.
Comparison of the Tva display on the surface of CEFs from CB, L15, and P chicken lines. Cells were incubated with crude extracellular supernatants containing the SU(A)-rIgG immunoadhesin and with goat-anti-rabbit IgG conjugated with Alexa Fluor 488. The relative fluorescence is plotted against the cell count: open bold peak, L15 CEFs; overlapping open thin and shaded peaks, CB and P CEFs, respectively.

