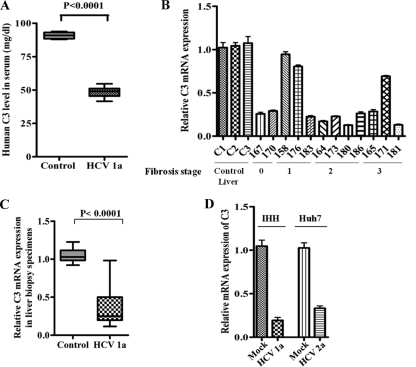
Fig 1.
HCV infection transcriptionally represses C3 expression. (A) A significant reduction in total C3 expression among HCV genotype 1a-infected patient sera (n = 12) compared with sera from (n = 6) from healthy controls. (B and C) Downregulation of C3 mRNA expression in HCV genotype 1a-infected paired liver biopsy specimens (marked with 3-digit numbers) compared with non-HCV-infected control liver tissues (C1, C2, and C3) by real-time PCR. Results were normalized to endogenous 18S RNA and are shown as individual samples organized according to the fibrosis stage of the patient liver (B) as well as in a box plot (C) (P < 0.0001, as a group of experimental samples compared to controls using one-way ANOVA). (D) Estimation of C3 mRNA expression by real-time PCR from IHH infected with HCV genotype 1a or Huh7 cells infected with HCV genotype 2a. C3 mRNA expression in parental hepatocytes was arbitrarily set at 1, and the results for the infected hepatocytes were statistically significantly different (P < 0.0001) using one-way ANOVA.

