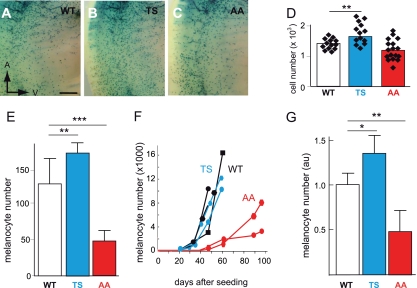
Fig 3.
In vivo melanoblast proliferation is induced by BRN2TS and repressed by BRN2AA. (A to D) Number of melanoblasts in WT-Lac, BRN2TS-LacZ (TS), and BRN2AA-LacZ (AA) embryos at E13.5 in the trunk region between the front and back limbs, from somites 13 to 25. Melanoblasts were genetically labeled using Dct::LacZ and identified by eye as X-Gal-positive cells. The number of melanoblasts was estimated to be 1,388 ± 183 for WT embryos (14 independent embryo sides), 1,750 ± 350 for TS embryos (14 independent embryo sides), and 1,201 ± 340 for AA embryos (17 independent embryo sides). The P value is 0.003 for WT versus TS mice (**) and 0.08 for WT versus AA mice. The anterior (A) and ventral (V) orientations of embryos are indicated in panel A. Note that the intensity of X-Gal staining is similar in WT and mutant melanoblasts and that the level of expression of Dct is slightly affected, but it is not for Tyr and Tyrp1, by the expression of BRN2TS or BRN2AA (see Fig. S7 at the URL mentioned in the introduction) (E) Numbers of WT, TS, and AA melanocytes 5 days after the explantation of newborn skin. Similar numbers of cells isolated from the skin of 3-day-old pups were grown in culture. The number of melanocytes was estimated in six independent cultures of cells from WT pups, four independent cultures of cells from TS pups, and eight independent cultures of cells from AA pups. StatView software was used for statistical analysis. **, P < 0.01; ***, P < 0.001. (F) Primary melanocyte growth curves. Melanocytes were established in culture from two independent WT (black), two independent TS (blue), and two independent AA (red) new born pups, and growth curves were determined from the numbers of pigmented cells. Each point is derived from the mean count of melanocytes from duplicate dishes. On day zero, 106 cells containing a mixture of melanocytes, keratinocytes, and fibroblasts were seeded for each WT, TS, and AA mouse. (G) Numbers of X-Gal-positive cells estimated from at least three independent WT-LacZ, TS-LacZ, and AA-LacZ tails. au, arbitrary units. StatView software was used for statistical analysis: *, P < 0.05; **, P < 0.01.

