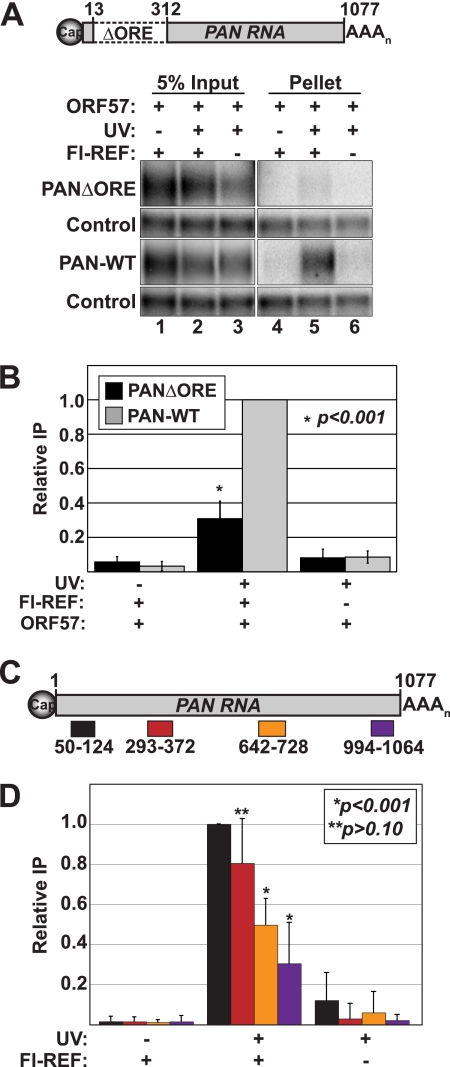
Fig 2.
REF/Aly recruitment is enhanced by the ORE, and its binding is enriched at the PAN RNA 5′ end. (A) (Top) Diagram of PANΔORE RNA. The numbers refer to the PAN RNA nucleotide sequence relative to its transcription start site (68). (Bottom) Representative Northern blots from a UV cross-linking coimmunoprecipitation experiment with a wild-type PAN (PAN-WT) and PANΔORE RNAs. Details are as in Fig. 1. (B) Quantification of data from PANΔORE cross-linking experiments. Error bars represent standard deviations, and P values are from an unpaired Student's t test of the PAN-WT and PANΔORE data sets from the +UV +Fl-REF +ORF57 samples (n = 4). IP, immunoprecipitation. (C) Diagram of the amplicons used for qRT-PCR. (D) Results from UV-cross-linking qRT-PCR experiments. The data are plotted for each of the indicated samples and controls. The colors used in the bar graphs match the depiction of the amplicons in panel C. The bars are the mean percent immunoprecipitation values relative to that of the 5′-most amplicon, and the error bars show standard deviations (n = 3). Determination of primer efficiencies was described previously (57, 66). P values are from a two-tailed, unpaired Student's t test comparing each data set to that of the 5′-most amplicon.

