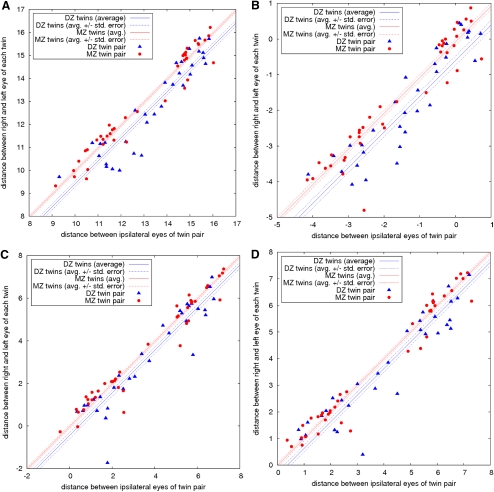
Figure 3.
Average intratwin incongruencies as a function of the average intertwin incongruencies. The incongruencies are computed with respect to the four most discriminant visual features: (a) the area covered by drusen, feature 23; (b) the semivariogram of the drusen distribution, feature 41; (c) the Geary's c of the drusen distribution, feature 38; and (d) the Moran's I of the drusen distribution, feature 37. The incongruencies are displayed on a logarithmic scale.

