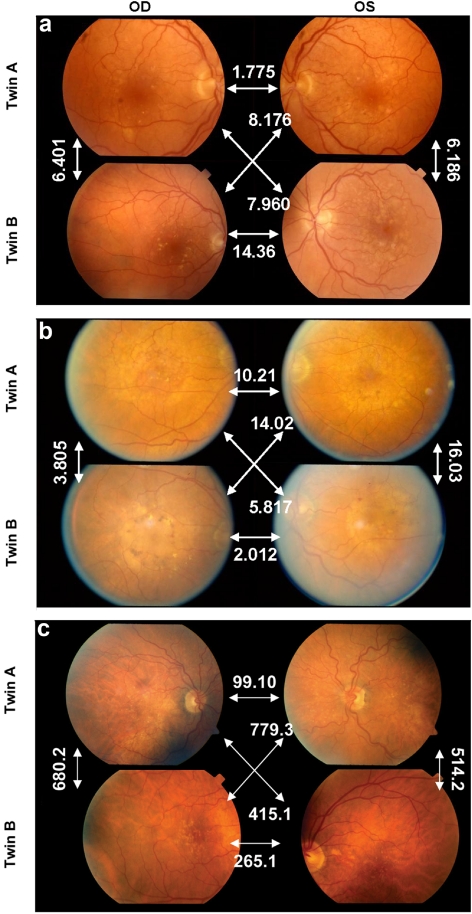
Figure 7.
(a–c) White arrows: typical interimage incongruencies in three twin pairs for feature 38, representing the spatial autocorrelation of the lesion distribution (Geary's c) and the intertwin incongruency for feature 38 between the individuals in each twin pair. (a) MZ twin pair with similar donutlike distribution of drusen in all four eyes, with an intertwin incongruency of 0.890. (b) MZ twin pair with spread out drusen in individual A, but homogenous drusen perifoveally in individual B and an intertwin incongruency of 1.62. (c) DZ twin pair with spread out drusen in individual A but clustered in individual B in both eyes and an intertwin incongruency of 11.7 with respect to feature 38. The area covered by drusen (feature 23) was approximately identical in each image in (a) and (b).

