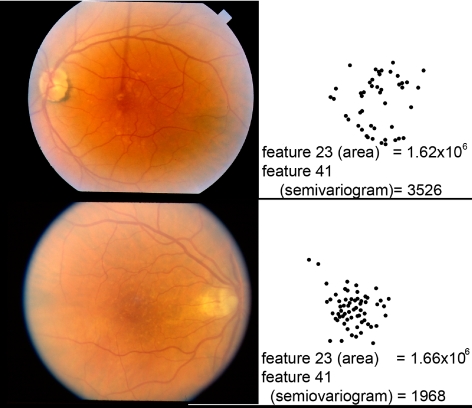
Figure 9.
Feature 41, a semivariogram of the drusen distribution, in two images from two individuals from different twin sets, with similar values for feature 23 (total area of drusen), but highly different values for feature 41 (semivariogram). Left: fundus images; right: drusen detected on the same scale.

