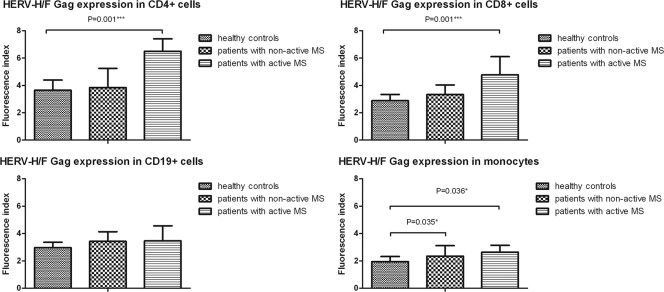
Fig 3.
Flow cytometry analysis of intracellular HERV-H/F Gag expression in PBMCs from healthy controls and patients with nonactive and active MS. The bar graphs show comparative analysis of HERV-H/F Gag expression in CD4+ T cells, CD8+ T cells, CD19+ B cells, and monocytes in peripheral blood of healthy controls and patients with nonactive and active MS. The y axis represents FI. The bars show the median values and SD. The P values show statistical differences (<0.05) between the different groups. P values were calculated using the nonparametric Mann-Whitney U test. *, P ≤ 0.05; ***, P ≤ 0.001.

