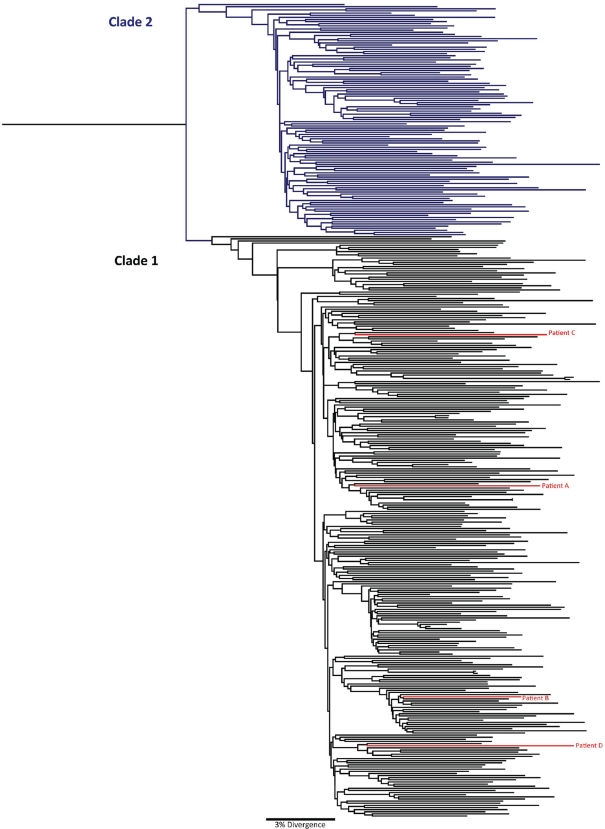
Fig 3.
Phylogenetic tree showing evolutionary relationships between 382 complete HCV-1a genome sequences. A maximum likelihood phylogenetic tree is presented that demonstrates the separation of the HCV-1a isolates into two distinct clades: clade 1 (black) and clade 2 (blue). The four consensus sequences generated in this study (for patients A to D) are highlighted in red and grouped in clade 1.

