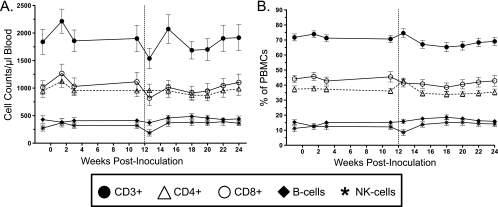
Fig 1.
Quantitative immunophenotyping of peripheral lymphocyte subsets based on flow cytometric analysis of surface markers. (A) Enumeration of absolute numbers of T cells (CD3+, CD3+ CD4+, and CD3+ CD8+), B cells (CD20+) and NK cells (CD3− CD16+ CD56+) per μl of blood represented as the mean ± standard error of the mean for all animals. (B) The relative distribution of each cell subset is listed as a percentage of total PBMCs. The vertical hashed line indicates the time of intravenous inoculation.

