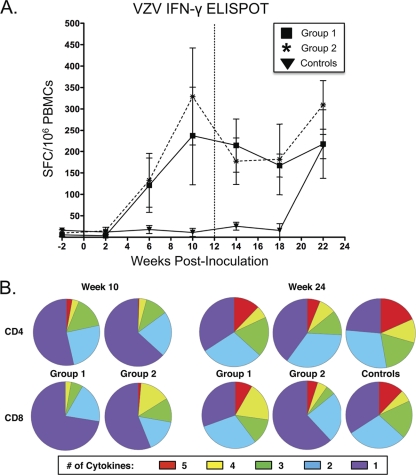
Fig 4.
VZV-specific cell-mediated immunity. (A) IFN-γ ELISPOT assay responses in PBMC preparations following stimulation with whole VZV antigen. Data points represent the background-subtracted mean response from at least three replica wells on each of two duplicate plates per experiment with error bars indicative of the standard error of the mean. Responses are indicated as the numbers of IFN-γ-producing cells as SFC per million PBMCs. Time zero represents the initial intratracheal inoculation, and the vertical hashed line indicates the time of intravenous inoculation 12 weeks later. (B) Cytokine profile of T-cell immunity following stimulation with peptide pools spanning the VZV IE63, ORF4, gI, and gE proteins as measured by intracellular cytokine secretion of IFN-γ, MIP-1β, TNF-α, IL-2, and CD107a. Boolean gating on FlowJo software was used to determine the extent of coincident cytokine secretion. Pie charts generated using SPICE software represent the mean multifunctional responses directed against all peptide pools for each group.

