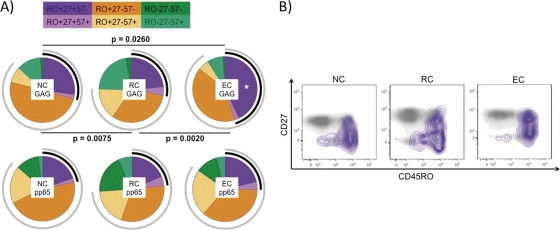
Fig 2.
Gag-specific CD4 T cell response. (A) Maturation patterns (analyzed by CD45RO, CD27, and CD57 expression) of pp65- and Gag-specific T cells. Black arcs correspond to CD27 expression, and gray arcs correspond to CD45RO expression. Statistically significant differences among the maturation patterns are shown in the figure. Gag-specific CD4 T cells with the CD45RO+ CD27+ CD57− (Mem57−) maturation profile were increased significantly (*) in the EC group. (B) Gag-specific CD4 T cells (defined by intracellular cytokine production of IFN-γ, TNF-α, and/or IL-2) are shown with purple isobars and overlaid onto two-dimensional plots for total CD4+ T cells plotted against CD27 and CD45RO. EC, elite controllers; RC, relative controllers; NC, noncontrollers.

