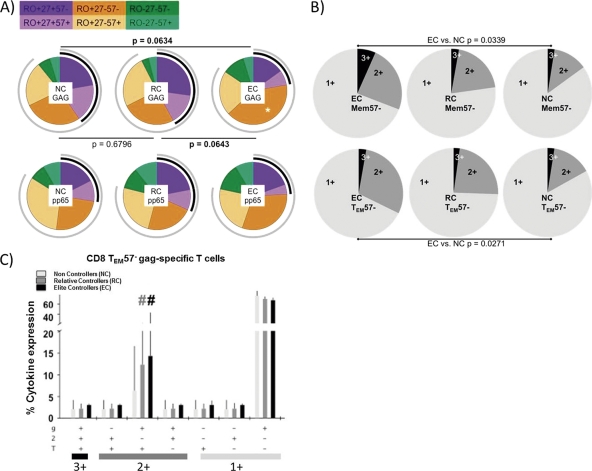
Fig 4.
Gag-specific CD8 T cell response. (A) Maturation patterns of pp65- and Gag-specific CD8 T cells. Black arcs correspond to CD27 expression, while gray arcs correspond to CD45RO expression. Statistically significant differences among the pies are shown. Gag-specific CD8 T cells with the TEM57− maturation profile were increased significantly (*) in the elite controller group. (B) Individual pie charts show Mem57− and TEM57− HIV-specific T cells which produce 1, 2, or 3 functional responses to Gag stimulation for every HIV group. (C) Comparison of functionality of Gag-specific TEM57− effector T cells among the different HIV groups. T, TNF; 2, IL-2; g, IFN-γ; EC, elite controllers; RC, relative controllers; NC, noncontrollers. #, P < 0.05.

