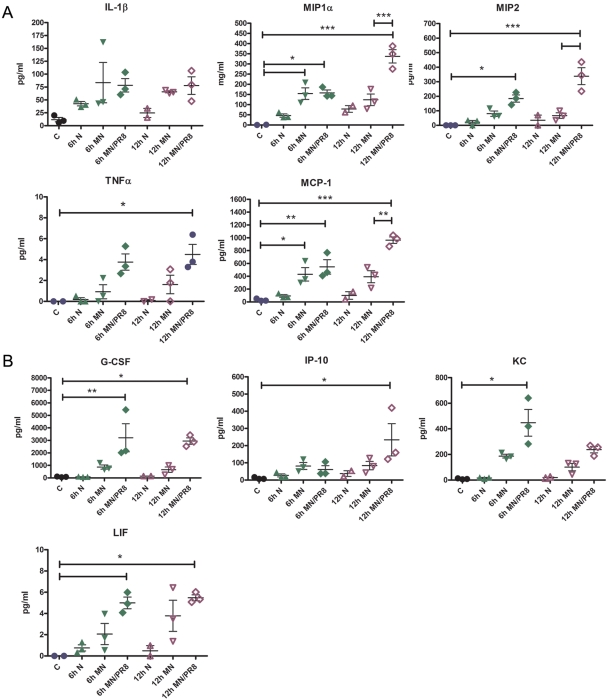
FIG 1 .
Inflammatory cytokine release after MN immunization with inactivated influenza virus. Skin samples were collected 6 h and 12 h after MN immunization with 3 µg of inactivated virus, and tissue lysates were evaluated for cytokine release by Luminex multiplex assay. The graphs show the concentrations of the cytokines that were differentially expressed for the following mouse groups: C, naive control; 6 h N, 6-h naive shaved; 6 h MN, 6-h MN mock; 6 h MN/PR8, 6-h PR8-coated MN; 12 h N, 12-h naive shaved; 12 h MN, 12-h MN mock; and 12 h MN/PR8, 12-h PR8-coated MN. Data are representative of two experiments, and data are means ± SD (n = 3). Asterisks indicate the statistical significance of selected comparisons: *, P ≤ 0.05; **, P ≤ 0.01; and ***, P ≤ 0.001.

