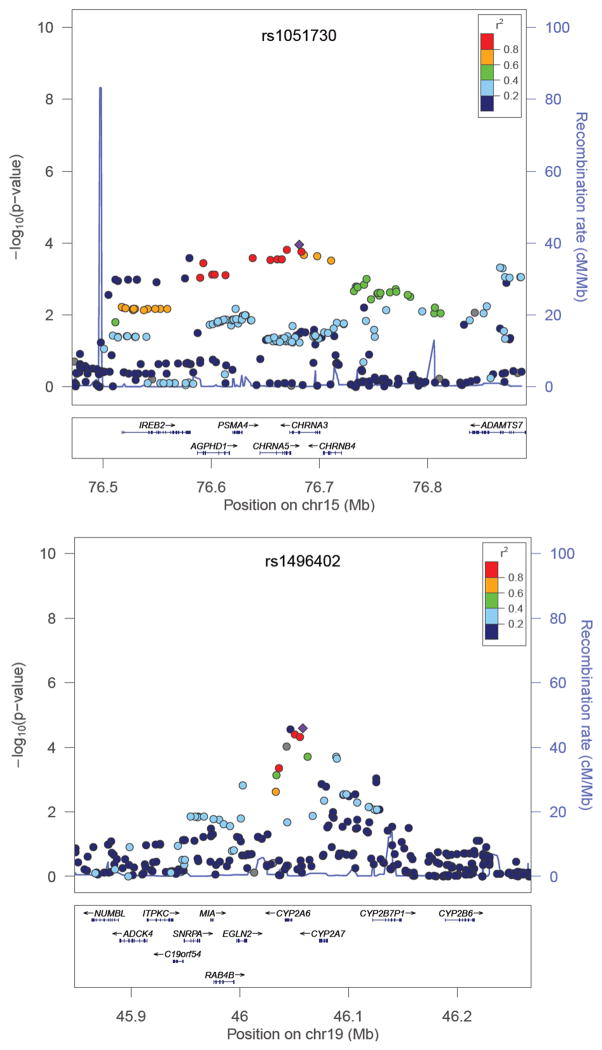
Figure 2. Regional association plots of the candidate loci centered on CHRNA3 (top) and CYP2A6 (bottom) and their associations with lifetime average number of cigarettes smoked per day.
Dots correspond to meta-analyzed SNPs. Color of dots correspond to r2 (linkage disequilibrium (LD) coefficient in the HapMap II CEU population; grey dots correspond to SNPs with missing LD information) relative to the most significantly associated SNP in the region (depicted with diamond) i.e. rs1051730 in the CHRNA3 (top figure) and rs1496402 (bottom figure; the second top SNP in this region is a nonsynonymous (Leu160His) rs1801272 SNP in the CYP2A6).
CHRNA3=alpha-nicotinic acetylcholine receptor 3; CYP2A6=Cytochrome P450 2A6

