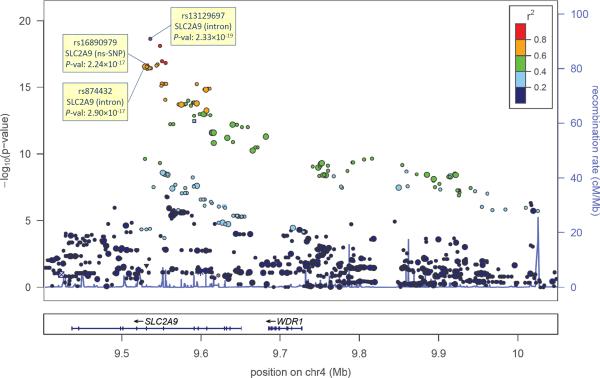
Figure 2.
LocusZoom plot of the SLC2A9 region. GC adjusted single-locus P-values are plotted against SNP physical positions (NCBI build 36). Pairwise linkage disequilibrium (r2) from the most significant SNP (rs13129697) is color-coded. Size of each dot indicates whether the SNP is a genotyped (large) or imputed (small). The light blue curve shows the local recombination rate based on HapMap Phase II data. rs16890979 is the non-synonymous SNP and rs874432 is the most significant genotyped SNP.

