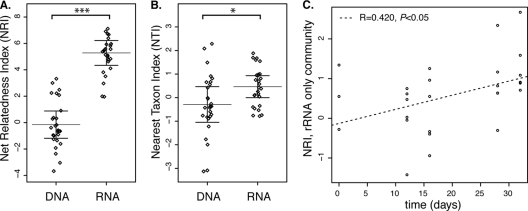
Fig 1.
The Phylocom package comstruct was used to calculate the NRIs and NTIs (26). The mean phylogenetic distance (MPD) and mean nearest phylogenetic taxon distance (MNTD) for each sample are compared to the MPD and MNTD values for null communities. The null model consists of species drawn randomly from the sample pool without replacement. Tree-wide clustering metric NRI (as measured by MPD) (A) and branch tip clustering metric NTI (as measured by MNTD) (B) of the rRNA- and rRNA gene-based microbial communities (RNA and DNA, respectively). Graphs display the data (jittered for clarity), with bars denoting the mean and one standard error of three replicates (n = 27). (C) Plot of net relatedness indexes (NRI) of the community detectable by rRNA but not by rRNA genes over time, with linear models displayed. The original data are also available in tabular format (see Table S3 in the supplemental material).

