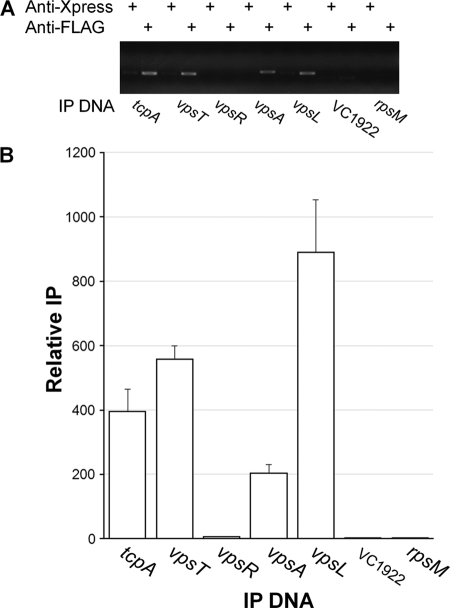
Fig 5.
ChIP analysis of H-NS binding to vps promoters. (A) Agarose gel electrophoresis of the PCR products obtained after ChIP using anti-FLAG and anti-Xpress (mock reaction) monoclonal antibodies. (B) Quantification by qPCR of H-NS occupancies at the corresponding promoter. Each value represents the mean for three experiments, and error bars indicate the standard deviations.

