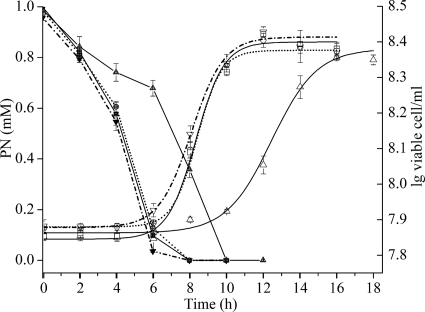
Fig 5.
Time course of PN degradation and cell growth in cultures of strain HZN6 and its derivatives. PN concentrations (left y axis) (black symbols) in strain HZN6 (■), strain N6Δsap (▲), N6Δsap (●) after culturing with PN for several generations (dotted line), and N6ΔpaoC (▼) (dash dot line) are shown. Cell growth (right y axis [lg, log]) (open symbols) of HZN6 (□), N6Δsap (▵), N6Δsap (○) after culturing with PN for several generations (dotted line), and N6ΔpaoC (▿) (dash dot line) is shown.

