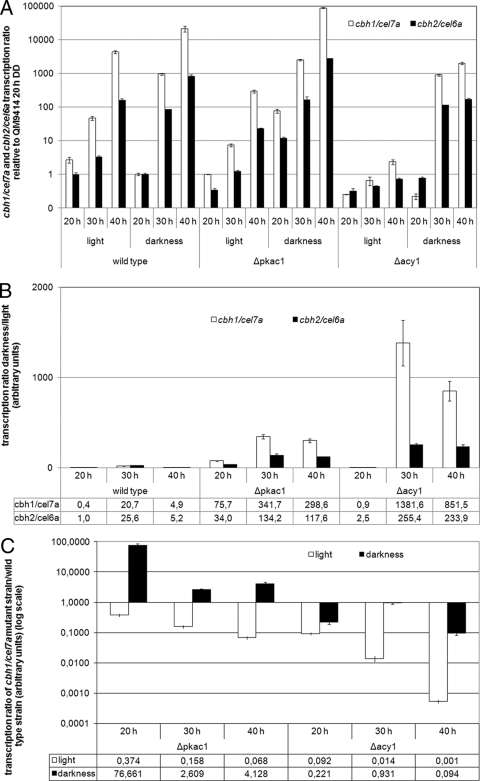
Fig 3.
Transcript levels of the major cellulase genes cbh1/cel7a and cbh2/cel6a as influenced by the absence of PKAC1 or ACY1. Transcript abundance was analyzed by qRT-PCR after 20, 30, or 40 h of growth in Mandels-Andreotti minimal medium with 1% (wt/vol) lactose as a carbon source in constant light or constant darkness. (A) Transcript levels of cbh1/cel7a and cbh2/cel6a in the wild-type QM9414 and the Δacy1 and Δpkac1 mutants. Values are shown as fold changes relative to that for QM9414 after 20 h in darkness. (B) Transcript ratios in darkness versus light of cbh1/cel7a and cbh2/cel6a in wild-type QM9414 and the Δacy1 and Δpkac1 mutants. Relative mean values of fold regulation for cbh1/cel7a and cbh2/cel6a are given below the diagram. (C) cbh1/cel7a transcript ratio in mutant versus wild-type strains in constant light or constant darkness. Relative mean values of fold regulation are given below the diagram.

