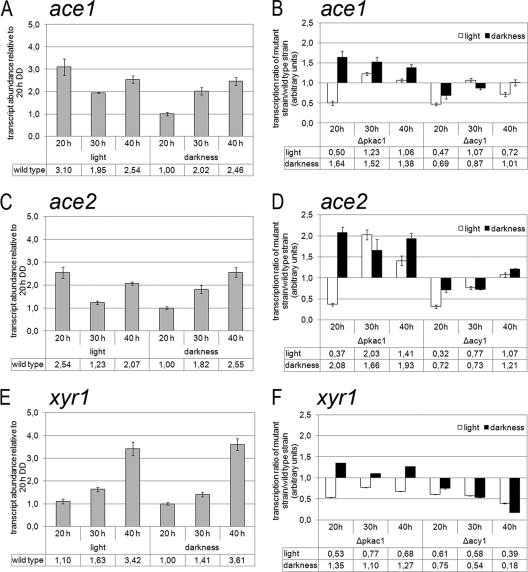
Fig 5.
Analysis of transcript abundances of the transcription factor-encoding genes ace1 (A and B), ace2 (C and D), and xyr1 (E and F) by qRT-PCR. (A, C, and E) Transcript abundances of ace1 (A), ace2 (C), and xyr1 (E) in QM9414. Values are shown as fold changes relative to the value for QM9414 in constant darkness after 20 h of growth. (B, D, and F) Transcript ratios of ace1 (B), ace2 (D), and xyr1 (F) between QM9414 and mutant strains. Transcript abundance was analyzed by qRT-PCR during cultivation of wild-type QM9414 and the Δpkac1 and Δacy1 mutants in liquid Mandels-Andreotti medium with 1% (wt/vol) lactose as a carbon source after 20, 30, or 40 h of growth in constant light or constant darkness.

