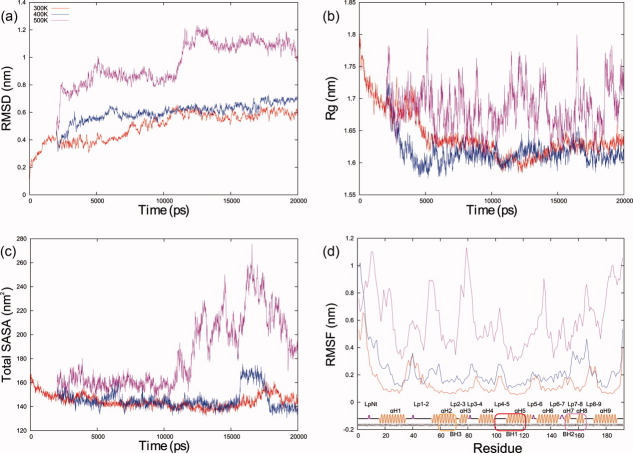
Figure 2.
Measurements from the MD simulations. Time evolution of (a) α-carbons RMSD, (b) radius of gyration, and (c) solvent accessible surface area of the protein at different temperatures. (d) The root mean square fluctiations of α-carbons coordinates are shown as a function of residue number at different temperatures; a representation of the secondary structure with labels for the main domains is included. The color coding defined in (a) is the same in all plots. [Color figure can be viewed in the online issue, which is available at wileyonlinelibrary.com.]

