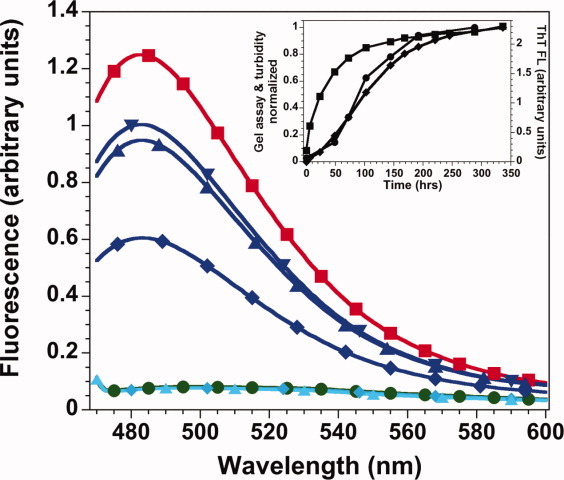
Figure 3.

ThT fluorescence spectra. Low intensity, overlapping spectra: ThT alone, green circles; H3-H4 at pH 7.2 in 6M urea (light blue symbols) at t = 0, diamonds, and t = 66 h, triangle. Spectra with (H3-H4)2 at pH 7.2 (dark blue symbols), t = 0, diamond; t = 19 h and t = 66 h, upward and downward triangles, respectively. Spectra of H3-H4 at pH 5, t = 0, red squares. Inset: representative kinetics of fibril formation by H3 + H4. The same sample was monitored by ThT FL, squares, gel precipitation, circles, and turbidity at 500 nm, diamonds. Conditions: 30 μM each of H3 and H4 monomers with 20 μM ThT at pH 7.2, 0.2M KCl, 20 mM potassium phosphate, 0.1 mM EDTA (standard folding conditions) or pH 5, 1M NaCl, 50 mM acetic acid/sodium acetate, and 50 mM phosphoric acid/NaH2PO4, 23°C. [Color figure can be viewed in the online issue, which is available at wileyonlinelibrary.com.]
