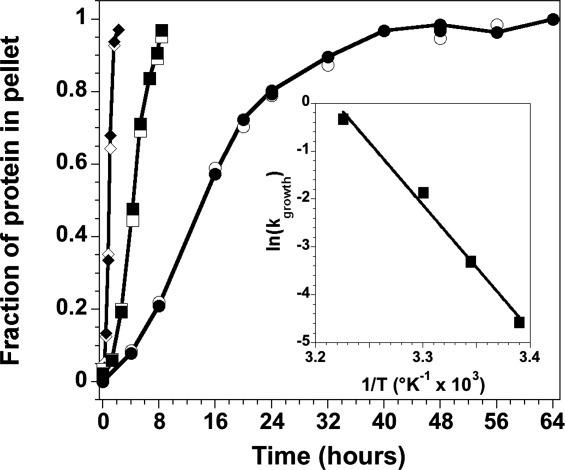
Figure 5.

Temperature dependence of fibril growth initiated from the (H3-H4)2 tetramer at pH 5. The data are from the gel precipitation assay, showing the fraction of precipitated protein for H3 (open symbols) and H4 (closed symbols, solid line). 26°C, circles; 30°C, squares; 37°C, diamonds. The lines are drawn to guide the eye and do not represent fits of the data. Inset: Arrhenius plot of the temperature dependence of the rate of fibril growth as determined from a linear fit of the precipitation assay data in the exponential growth time regime. Conditions are described in the legend of Figure 4.
