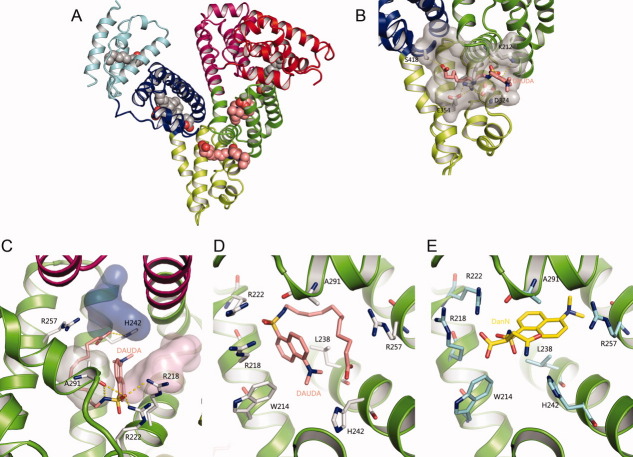
Figure 1.
Ligand-binding sites of the HSA–Myr–DAUDA complex. (A) Overview of the crystal structure of HSA-Myr-DAUDA shows DAUDA bound to FA6 and FA7 sites in the presence of myristate. The protein is shown as secondary structures and colored by subdomain. Myristate and DAUDA are shown in a ball representation with atoms colored by atom-type: C-grey for Myr and salmon for DAUDA; O-red; N-blue; S-yellow. This coloring scheme is used throughout this article. (B) Detailed molecular interactions of DAUDA at FA6 site with rHSA. FA6 site is shown semi-transparent gray surface. The key residues that participate in the formation of the trench and locate DAUDA are shown as sticks. Hydrogen bonds are shown in dotted yellow lines. (C) Detailed molecular interactions of DAUDA at FA7 site (subdomain IIA) with HSA. FA7 site can be divided as three subsites: AZT subsite (PDB code 3B9L, light purple), SAL subsite (PDB code 2I30, light grey), and IMN subsite (PDB code 2BXM, pink) and are shown as semi-transparent van der Waals surfaces. (D) Binding model of DAUDA with surround residues at FA7 site (subdomain IIA) on HSA. (E) Binding model of DanN with surround residues at FA7 site (subdomain IIA) on HSA. The HSA residues in contact with DanN are colored as cyan for carbon. [Color figure can be viewed in the online issue, which is available at wileyonlinelibrary.com.]

