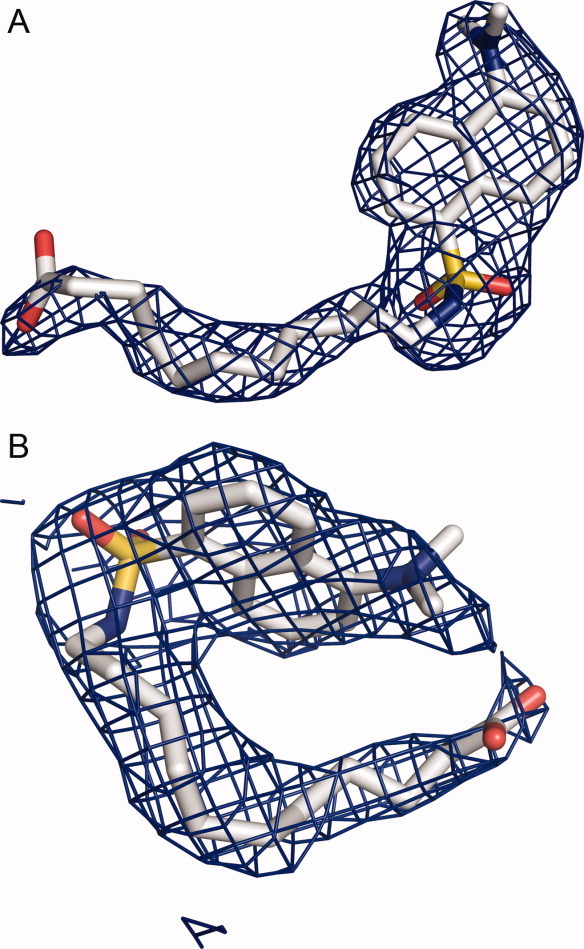
Figure 2.

2Fo–Fc electron density omit maps (contoured at 0.5σ) of the HSA–Myr–DAUDA complex at FA6 and FA7 sites were either much larger than what typically observed for myristate and was modeled with confidence to DAUDA molecules (shown in stick), which has a large dansyl head group compared with myristate. [Color figure can be viewed in the online issue, which is available at wileyonlinelibrary.com.]
