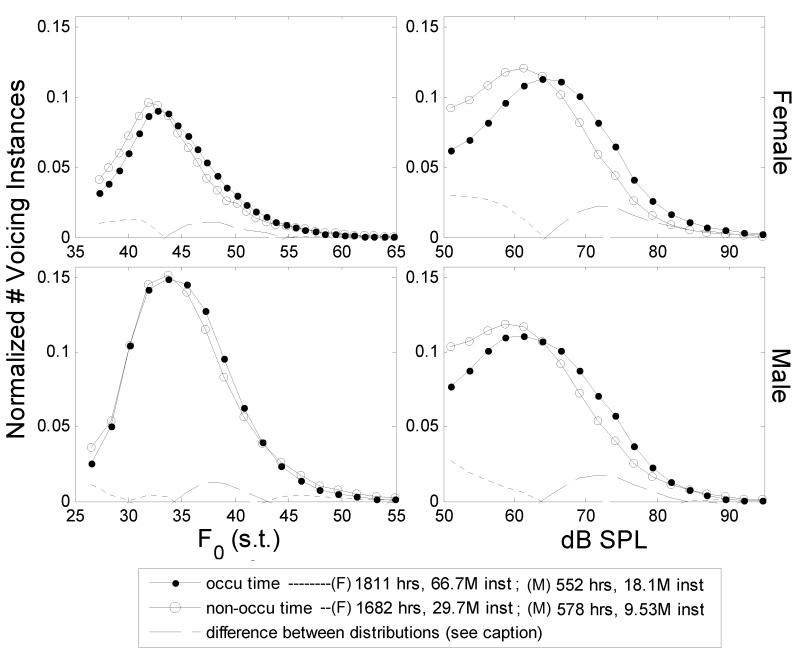
Figure 6.
Normalized distribution of voicing instances in terms of F0 (left, semitones, where semitone=39.86 log10(F0/16.25)) and loudness (right, dB SPL @ 30 cm) averaged over all subjects’ occupational weekday times (9:00 am - 3:00 pm) and non-occupational times (4:00 pm - 10:00 pm). Female data (N=45) are on the top; Male data (N=12) are on the bottom. The difference between the distributions is shown: Dotted line - non-occupational distribution greater than occupational; Dashed line - occupational distribution greater than non-occupational. Note that the normalized distributions hide the fact that there were more than twice the numbers of occupational instances than non-occupational instances (Female occupational distribution includes 66.7M 30msec voicing instances in 1181 hours of data and 29.7M in 1692 hours of data; Male occupational distribution includes 9.53M 30msec voicing instances in 578 hours of data and 18.1M in 552 hours of data).

