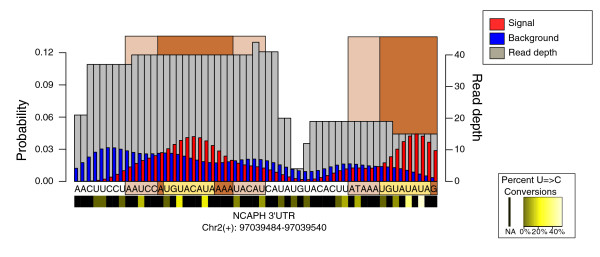
Figure 1.
Example of PARalyzer interaction site identification. The entire genomic region corresponds to a single read-group from the Pumilio2 library. The orange region represents the nucleotides where the signal kernel density estimate is above background. The light pink locations are the full interaction sites extended by up to 5 nucleotides. A light gold box highlights the sequences that match the known Pumilio2 binding motif.

