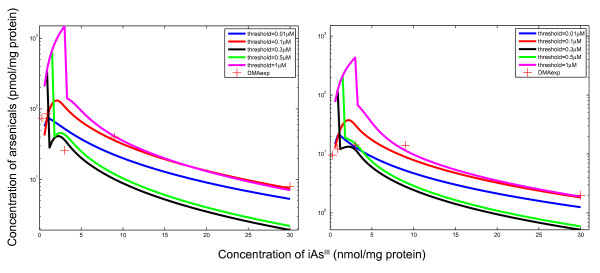
Figure 6.
Sensitivity testing of TK model predictions for varying assumptions of threshold levels. The left panel shows total amounts (in hepatocytes and the medium) of DMA, while the right panel shows intracellular levels of DMA. Experimental data are from Drobna et al. [53] for hepatocytes from a 63 year old white female

