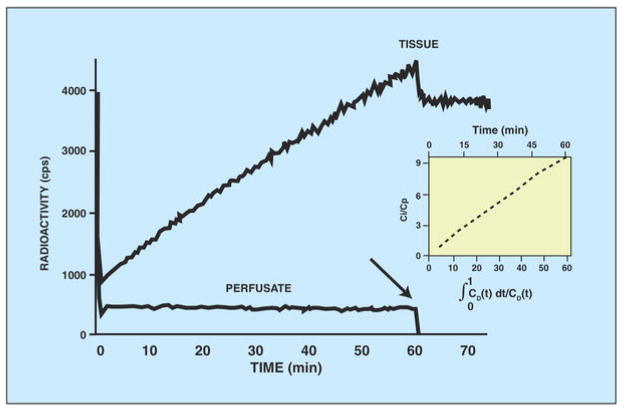
Figure 3. Diagram showing linear increase of radioactivity in the heart during perfusion with 18F-fluorodeoxyglucose-containing buffer.
Note that tissue radioactivity remains constant after a tracer-free buffer was used (arrow). Cardiac power was unchanged throughout the experiment (not shown). Patlak analysis shows linear tracer uptake with time (insert).

