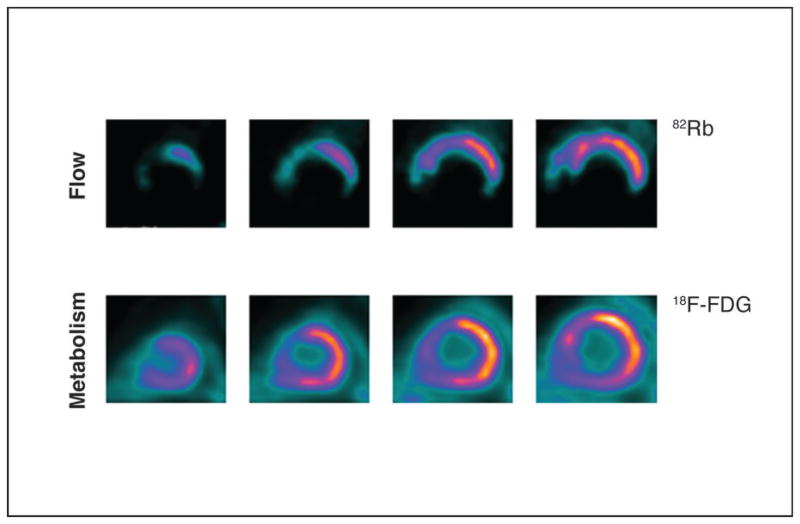
Figure 4. PET scan showing hibernating myocardium, revealing perfusion-metabolism mismatch.
(UPPER COLUMN) Blood flow imaging using rubidium 82 in short-axis view shows markedly decreased perfusion, extending from distal to basal slices in the apical, inferior, inferolateral and septal regions of the left ventricle at rest. (LOWER COLUMN) [18F]-fluorodeoxyglucose-labeled PET images acquired under glucose-loaded conditions shows preserved glucose utilization in abnormally perfused myocardium, except for the anteroseptal region, in which a metabolism matches perfusion. 18F-FDG: 18Ffluorodeoxyglucose; 82Rb: rubidium 82. (58)

