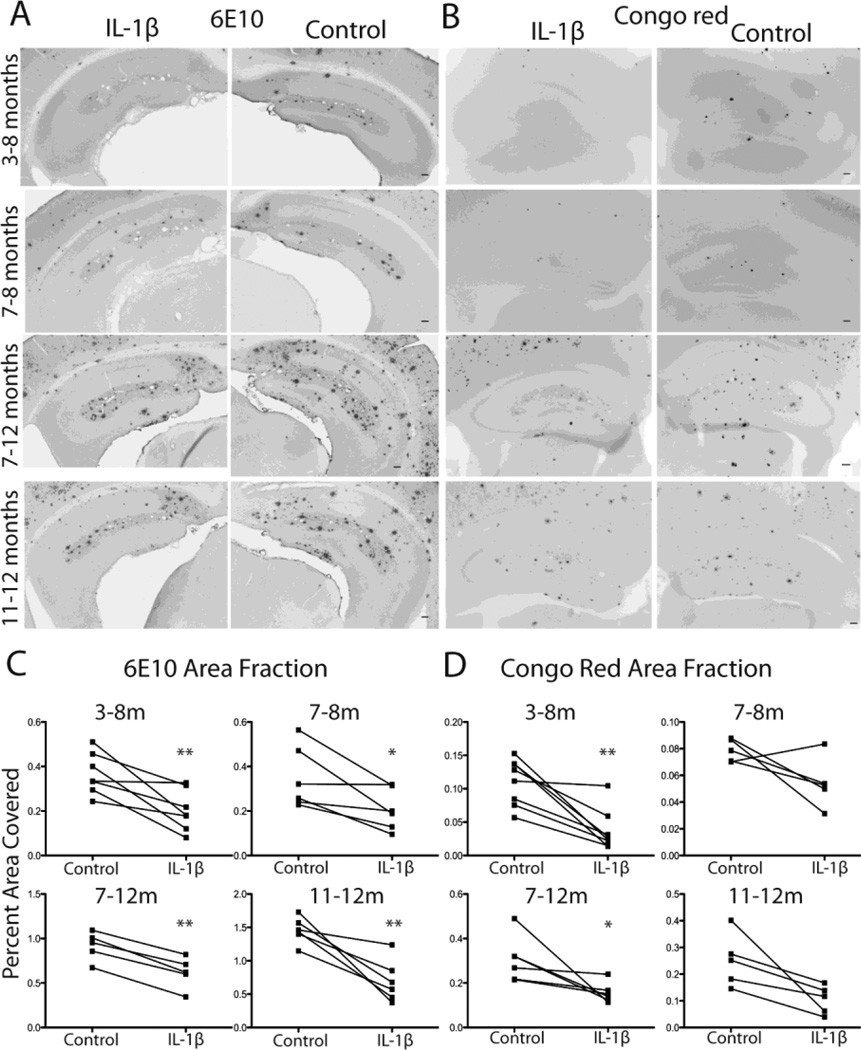
Figure 1.
Plaque indices following 1 or 5 months of IL-1β upregulation. A,B, Representative photomicrographs of 6E10 (A) and Congo red (B) labeling in hippocampus following 1 or 5 months of unilateral IL-1β upregulation at varied ages. Bar = 100 µm. C,D, Quantitative individual dot plot analysis of 6E10 (C) and Congo red (D) measured as percent area in hippocampus occupied by plaque. n = 5–8 per group. Data displayed as mean ± SEM. *p <0.05, **p <0.01 compared to control (FIV-LacZ injected) hemisphere. C=control, I=IL-1β, m=months of IL-1β overexpression.

