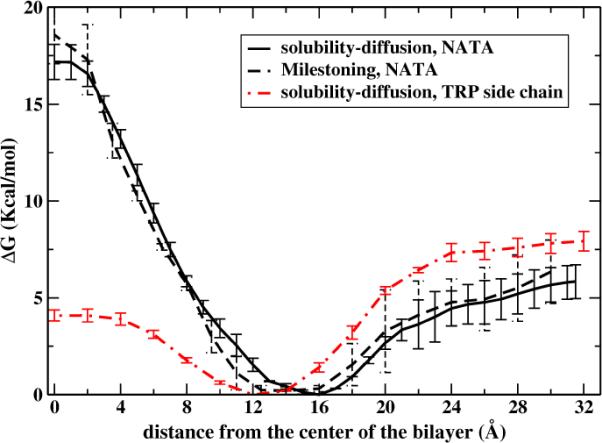
Figure 10.

A comparison between the potential of mean force for NATA permeation obtained with the solubility-diffusion model (solid line) or with Milestoning (black dashed line). The zero z position is the center of the membrane. The potential is an average over the two layers, and the error bars are estimated from the values of each layer. Also shown is the potential of mean force computed for the permeation of tryptophan side chain. The last calculation compares favorably with the results of other simulations17.
