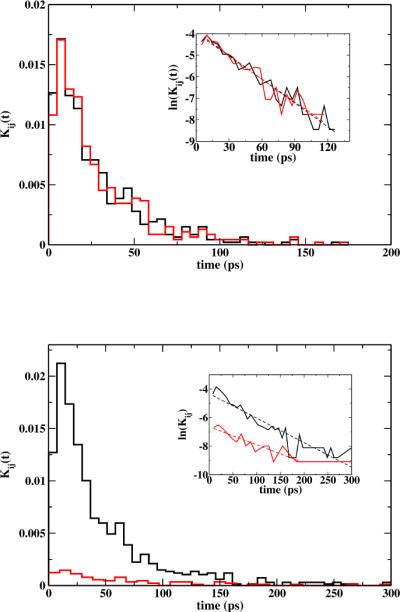
Figure 11.

Local first passage time distributions for milestones located at (top) and z = 0 z = 8 Å (bottom). In the top figure, the time distributions for trajectories that reach milestone Å are in black and z = 2 z = −2 Å in red. In the bottom figure, black correspond to the time distributions for trajectories ending at z = 9.5 Å and red for the ones ending at z = 6.5 Å. The insets show corresponding linear fitting of ln Kij versus time. For the fitting, we remove points with Kij = 0 and outliers at the long tails. Correlation coefficients for the fitting were bigger than 0.94 in all cases but the red plot at the bottom that has correlation coefficient of 0.90.
