
Figure 9.
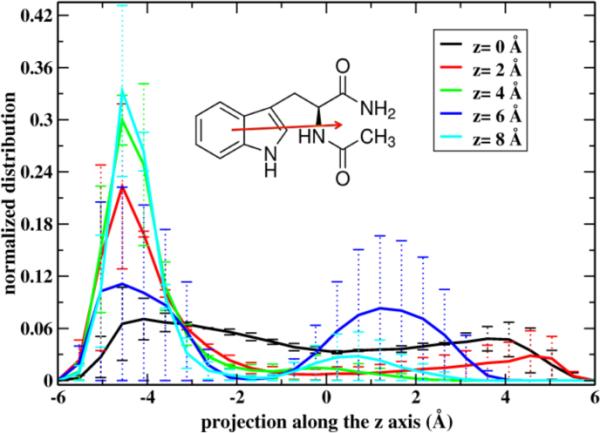
The distribution of the projection of the orientation vector of NATA with respect to the membrane normal. The orientation vector is defined as a vector connecting the center of masses of the side chain and backbone atoms of the amino acid (inset).
When the projection is negative the polar groups are pointing in the direction of the closest water layer. The solid lines are the averages over the two layers. The legend shows the distance of the permeant from the center.