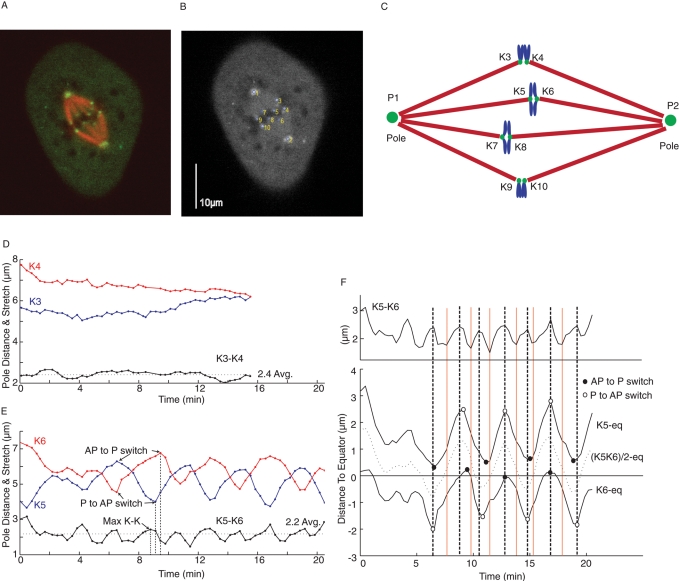
FIGURE 1:
Measurements of normal kinetochore and centromere oscillations for bioriented chromosomes in metaphase spindles of PtK1 cells. (A) PtK1 cell with fluorescently labeled kinetochores (green), spindle poles (green), and MTs (red). (B) Image of spindle in our Matlab analysis interface with labeled kinetochores and poles selected for time-lapse motion analysis of fluorescent centroid positions. (C) Spindle diagram with labels used for kinetochores and spindle poles in our measurements. Plots of kinetochore-to-pole distance (in red and blue) and K-K distance (in black) between sister kinetochores for two nonoscillating chromosomes at the spindle periphery (D) and two oscillating sister kinetochores in the same cell (E). Switch points on K-P curves and maximum K-K distance were recorded (see E). The time resolution (15–20 s) did not allow detailed analysis of the switch in directional instability to determine whether the switch is instantaneous or there is a pause around the switch point. If such a pause exists, the switch point would correspond to the mid time point of the pause period. (F) Kinetic plots for the oscillating sister pair in D, identifying switches in direction of movement (open and closed circles) relative to the maximum (black vertical lines) and minimum (red vertical lines) points in K-K centromere stretch and the position of the center of the centromere between sister kinetochores (dotted curve). Top, plot of K-K distance. Bottom, plots of sister kinetochore positions and the center of the centromere relative to the spindle equator calculated from (P2 − P1)/2.

