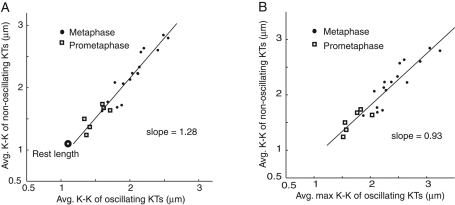
FIGURE 2:
Average and maximum K-K centromere stretch for normally bioriented chromosomes increases with mitotic progression. Average (A) and maximum (B) K-K centromere stretch for oscillating kinetochores, as well as nonoscillating kinetochores, plotted for each cell analyzed in prometaphase (open squares) through metaphase (solid circles). The rest length of the centromere is ∼1.1 μm in cells treated with nocodazole to inhibit MT assembly (Hoffman et al., 2001). The solid lines are a least-squares fit through the data.

